From Nighttime Lights to Interactive Web Maps: An End-to-End Geospatial Pipeline
Introduction
Nighttime lights data is one of the most powerful proxies for human activity, economic development, and infrastructure growth. Datasets derived from satellite sensors such as VIIRS allow us to analyze spatial and temporal patterns of light emissions across the globe.
In this post, I walk through an end-to-end workflow I used to turn raw nighttime lights raster data into an interactive web map, covering:
- Preparing and optimizing the data
- Converting rasters into Cloud Optimized GeoTIFFs (COGs)
- Hosting the data on AWS S3
- Securely serving map tiles using TiTiler
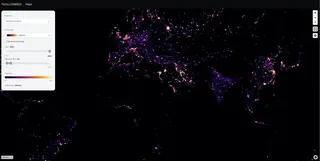
- Visualizing the data in a MapLibre frontend
The goal is to show how modern cloud-native geospatial tools fit together in a practical pipeline.
1. Nighttime Lights Data Generation
The starting point is a global nighttime lights raster dataset derived from satellite observations. These datasets are typically provided as GeoTIFFs, with pixel values representing average radiance or light intensity over a given period (e.g., yearly averages).
Key characteristics of the source data:
- Large raster size (global or near-global coverage)
- Continuous numeric values
- Time-based layers (one raster per year)
Before serving this data on the web, it needs to be optimized for cloud access and tiling.
A practical tip here: treat the raw rasters as your “analysis artifacts,” and generate a separate, web-optimized version for serving. This keeps your visualization stack fast without compromising your original data.
2. Preparing and Converting to Cloud Optimized GeoTIFFs (COGs)
A standard GeoTIFF is not ideal for web access because it requires downloading large portions of the file to read small regions. This is where Cloud Optimized GeoTIFFs (COGs) come in.
Why COGs?
COGs enable:
- HTTP range requests
- Efficient access to small spatial windows
- On-the-fly tile generation
Processing steps
For each yearly raster:
- Reproject to Web Mercator (EPSG:3857) for compatibility with web maps
- Normalize or rescale values where necessary
- Build internal overviews (pyramids)
- Save as a COG with compression
Typical tools used:
gdalwarpfor reprojectiongdal_translate(orrio cogeo) for COG creation
The result is a set of lightweight, cloud-friendly raster files ready for streaming.
Example: batch processing with GDAL
This is the general structure I used to reproject GeoTIFFs and output COGs.
#!/usr/bin/env bash
set -euo pipefail

mkdir -p warp cogs

for f in *.tif; do
  echo "Processing $f"

  # Reproject to Web Mercator for web map compatibility
  gdalwarp \
    -t_srs EPSG:3857 \
    -r bilinear \
    -multi \
    -wo NUM_THREADS=ALL_CPUS \
    "$f" "warp/$f"

  # Convert to Cloud Optimized GeoTIFF (COG)
  gdal_translate \
    "warp/$f" "cogs/$f" \
    -of COG \
    -co COMPRESS=DEFLATE \
    -co PREDICTOR=2 \
    -co BLOCKSIZE=256
done
Optional: validate COGs
If you use rio-cogeo, validation is quick:
rio cogeo validate cogs/nightlights_2019.tif
If validation passes, you can be confident the file will work well with HTTP range requests and tile servers like TiTiler.
3. Uploading COGs to AWS S3
Once the COGs are generated, they are uploaded to an AWS S3 bucket configured for object storage.
Access model
Instead of making the bucket public, I:
- Created an IAM user
- Generated an access key and secret
- Granted the user read-only access to the COG objects
This approach allows:
- Controlled access
- URL signing
- No public exposure of raw data
Each COG is stored with a predictable naming pattern (e.g. by year), making it easy to reference dynamically.
Upload example (AWS CLI)
aws s3 cp cogs/ s3://YOUR_BUCKET/nightlights/ --recursive
Minimal IAM policy (read-only to a prefix)
{
  "Version": "2012-10-17",
  "Statement": [
    {
      "Sid": "ReadOnlyNightlightsCOGs",
      "Effect": "Allow",
      "Action": ["s3:GetObject"],
      "Resource": ["arn:aws:s3:::YOUR_BUCKET/nightlights/*"]
    }
  ]
}
In practice, you should also apply least-privilege:
- only s3:GetObject for the prefix you need
- optionally block listing unless you actually require it (s3:ListBucket)
4. Secure Tile Serving with TiTiler
To serve raster tiles to the web frontend, I used TiTiler, a FastAPI-based dynamic tiling service.
Why Titiler?
TiTiler can:
- Read COGs directly from S3
- Generate XYZ map tiles on demand
- Apply rescaling and colormaps dynamically
- Avoid pre-generating tiles
Signed URLs
Since the S3 bucket is private, access works as follows:
- The backend generates a signed S3 URL using AWS credentials
- The signed URL is passed to TiTiler as a query parameter
- TiTiler reads the raster securely and serves tiles
This ensures:
- No AWS credentials are exposed to the client
- URLs automatically expire
- Access can be tightly controlled
AWS signing example (Python)
import boto3
import os

AWS_REGION = os.getenv("AWS_REGION", "us-east-2")
AWS_ACCESS_KEY_ID = os.getenv("AWS_ACCESS_KEY_ID")
AWS_SECRET_ACCESS_KEY = os.getenv("AWS_SECRET_ACCESS_KEY")

s3 = boto3.client(
    "s3",
    region_name=AWS_REGION,
    aws_access_key_id=AWS_ACCESS_KEY_ID,
    aws_secret_access_key=AWS_SECRET_ACCESS_KEY,
)

def presign_cog(bucket: str, key: str, expires_seconds: int = 300) -> str:
    """
    Generate a short-lived signed URL for a private COG in S3.
    """
    return s3.generate_presigned_url(
        ClientMethod="get_object",
        Params={"Bucket": bucket, "Key": key},
        ExpiresIn=expires_seconds,
    )
A small “proxy” endpoint pattern (recommended)
Instead of signing on the frontend, you typically expose a backend endpoint like:
GET /api/nightlights/cog-url?year=2019returns a signed URLfrontend uses that to configure tile fetching
That keeps:
AWS credentials off the client
control on the server (you can log, rate-limit, and enforce rules)
TiTiler tile request shape
TiTiler can serve a tile like:
GET /cog/tiles/WebMercatorQuad/{z}/{x}/{y}.png?url=<SIGNED_S3_URL>&rescale=0,60&colormap_name=inferno
Where:
urlis the signed S3 URLrescaleis a comma-separated list of min/max values to rescale the data tocolormap_nameis the name of a colormap to be applied to the raster
5. Serving Tiles to a MapLibre Frontend
On the frontend, I used MapLibre GL JS to visualize the data.
The workflow is simple:
MapLibre requests tiles using a standard XYZ URL template
Requests are routed to the TiTiler endpoint
TiTiler fetches data from S3 using the signed URL
Tiles are rendered dynamically in the browser
Because the data is served as raster tiles:
Performance is fast, even for global datasets
Styling (e.g. colormaps like inferno) can be adjusted without reprocessing data
Users can switch between years seamlessly
Example: add a raster tile layer in MapLibre
map.addSource("nightlights", {
  type: "raster",
  tiles: [
    // This endpoint can sign the COG server-side and forward to TiTiler
    "https://YOUR_API_DOMAIN/api/tiles/nightlights/{z}/{x}/{y}.png?year=2019"
  ],
  tileSize: 256
});

map.addLayer({
  id: "nightlights-layer",
  type: "raster",
  source: "nightlights",
  paint: {
    "raster-opacity": 0.85
  }
});
Example: switch years (client-side)
function setNightlightsYear(year) {
  const src = map.getSource("nightlights");
  src.setTiles([
    `https://YOUR_API_DOMAIN/api/tiles/nightlights/{z}/{x}/{y}.png?year=${year}`
  ]);
}
That pattern keeps the client simple, and the server remains the only component that ever touches AWS credentials.
Result: A Cloud-Native Geospatial Stack
This pipeline combines:
- Cloud Optimized GeoTIFFs for efficient storage
- AWS S3 for scalable object hosting
- TiTiler for secure, on-the-fly tile generation
- MapLibre for interactive visualization
The result is a flexible system where:
- Data stays private and secure
- No pre-tiling is required
- New datasets can be added with minimal effort
A key design decision here is that the “heavy” work happens either:
- once during preprocessing (COG creation), or
- just-in-time on the server (tile rendering)
The frontend remains lightweight and focused on UX.
Closing Thoughts
This project highlights how modern geospatial tooling enables efficient, scalable, and secure delivery of large raster datasets to the web. By embracing cloud-native formats and services, it’s possible to build interactive geospatial applications without heavy infrastructure or complex preprocessing pipelines.
In future posts, I plan to dive deeper into:
- Raster value normalization strategies
- Colormap design for nighttime lights
- Performance tuning for large-scale TiTiler deployments
- Avoiding “out of bounds” tile requests when datasets don’t cover the full world extent